Microbial diversity
What this marker measures
This marker measures gut microbial diversity using the Shannon Diversity Index, which captures both the number of detected species, or richness, and how evenly they are distributed, or evenness, within the microbial community. A low score may reflect too few species, dominance by a small number of species, or both. Considering microbial diversity alongside richness helps provide a fuller picture of gut microbial community structure.
Clinical associations
Consider this marker when your patient presents with:
Interpreting the result
All results are compared to Microba's healthy cohort to determine whether they fall within or outside the expected range.
Patient management insights
Support microbial diversity through diet and lifestyle.
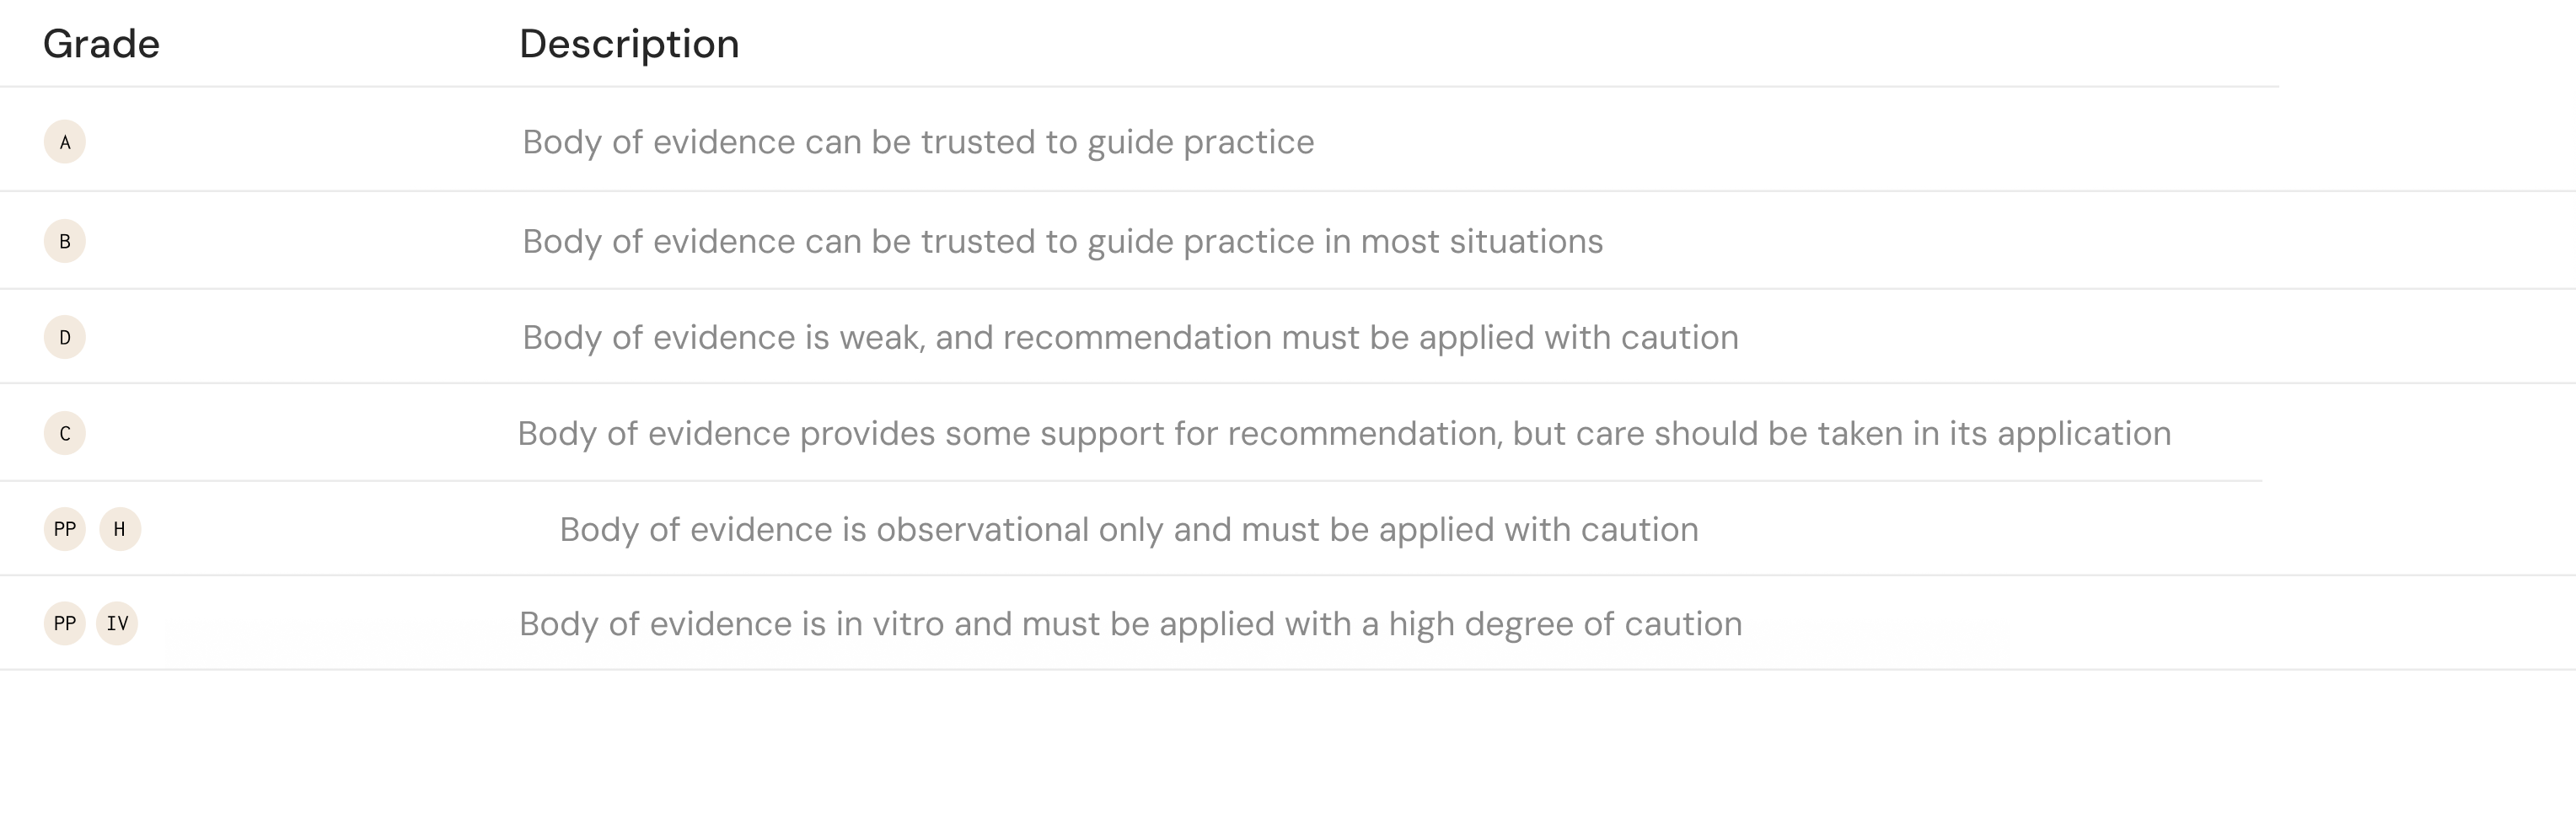
GRADE D
GRADE D

Tips for patients discussion
Your report shows lower-than-ideal gut microbial diversity. Think of your microbiome like a garden: we want many different species, not just a few dominant ones. A key way to support diversity is eating a varied, minimally processed diet with diverse plant foods and quality proteins.
How results are calculated
All microbiome marker results are compared against the Microba Healthy Cohort — a purpose-built reference group of more than 450 healthy individuals, collected and analysed using the same workflow as patient samples.
Each marker is scored by comparing the patient's relative abundance against the cohort average. The distance from this average is expressed as standard deviations, and determines whether a result is classified as Low, Borderline, or High.
Source references for all clinical associations, interpretation definitions, and patient management insights on this card.
1. Phan, J. et al. Gut health predictive indices linking gut microbiota dysbiosis with healthy state, mild gut discomfort, and inflammatory bowel disease phenotypes using gut microbiome profiling. Microbiology Spectrum 13, e00271-25 (2025).
2. Zheng, J. et al. Noninvasive, microbiome-based diagnosis of inflammatory bowel disease. Nat Med 30, 3555–3567 (2024).
3. Mujagic, Z. et al. Integrated fecal microbiome–metabolome signatures reflect stress and serotonin metabolism in irritable bowel syndrome. Gut Microbes 14, 2063016 (2022).
4. Vich Vila, A. et al. Gut microbiota composition and functional changes in inflammatory bowel disease and irritable bowel syndrome. Science Translational Medicine 10, eaap8914 (2018).
5. Spragge, F. et al. Microbiome diversity protects against pathogens by nutrient blocking. Science 382, eadj3502 (2023).
6. Kampmann, C., Dicksved, J., Engstrand, L. & Rautelin, H. Composition of human faecal microbiota in resistance to Campylobacter infection. Clinical Microbiology and Infection 22, 61.e1-61.e8 (2016).
7. Kamada, N. et al. Regulated Virulence Controls the Ability of a Pathogen to Compete with the Gut Microbiota. Science 336, 1325–1329 (2012).
8. Su, Q.-Y. et al. Gut microbiota dysbiosis in ankylosing spondylitis: a systematic review and meta-analysis. Front. Cell. Infect. Microbiol. 14, (2024).
9. Chanda, D. & De, D. Meta-analysis reveals obesity associated gut microbial alteration patterns and reproducible contributors of functional shift. Gut Microbes 16, 2304900 (2024).
10. Liu, Y. et al. Associations between changes in the gut microbiota and liver cirrhosis: a systematic review and meta-analysis. BMC Gastroenterol 25, 16 (2025).
11. Chu, Y. et al. Metagenomic analysis revealed the potential role of gut microbiome in gout. npj Biofilms Microbiomes 7, 66 (2021).
12. Oh, T. G. et al. A Universal Gut-Microbiome-Derived Signature Predicts Cirrhosis. Cell Metabolism 32, 878-888.e6 (2020).
13. Segev, T. et al. Diet–microbiome associations in 10,068 individuals from the Human Phenotype Project to guide personalized nutrition. Nat Med 1–11 (2026) doi:10.1038/s41591-026-04312-x.
14. Singh, R. et al. Temporal nutrition analysis associates dietary regularity and quality with gut microbiome diversity: insights from the Food & You digital cohort. Nat Commun 16, 8635 (2025).
15. Huang, X. et al. Dietary variety relates to gut microbiota diversity and abundance in humans. Eur J Nutr 61, 3915–3928 (2022).
16. Koponen, K. K. et al. Associations of healthy food choices with gut microbiota profiles. The American Journal of Clinical Nutrition 114, 605–616 (2021).
17. Lim, R. R. X. et al. Gut microbiome responses to dietary intervention with hypocholesterolemic vegetable oils. npj Biofilms Microbiomes 8, 24 (2022).
18. Du, Y. et al. Prevalence of Chronic Diseases and Alterations of Gut Microbiome in People of Ningxia China During Urbanization: An Epidemiological Survey. Front. Cell. Infect. Microbiol. 11, (2021).
19. Nurminen, N. et al. Nature-Derived Microbiota Exposure as a Novel Immunomodulatory Approach. Future Microbiology 13, 737–744 (2018).