Microbial richness
What this marker measures
This marker measures the number of distinct microbial species detected within the gut community. Unlike diversity, which also accounts for evenness, richness captures only how many species are present. Low richness may indicate reduced community complexity and resilience1,2, while high richness may reflect dietary diversity3,4.
Clinical associations
Consider this marker when your patient presents with:
Interpreting the result
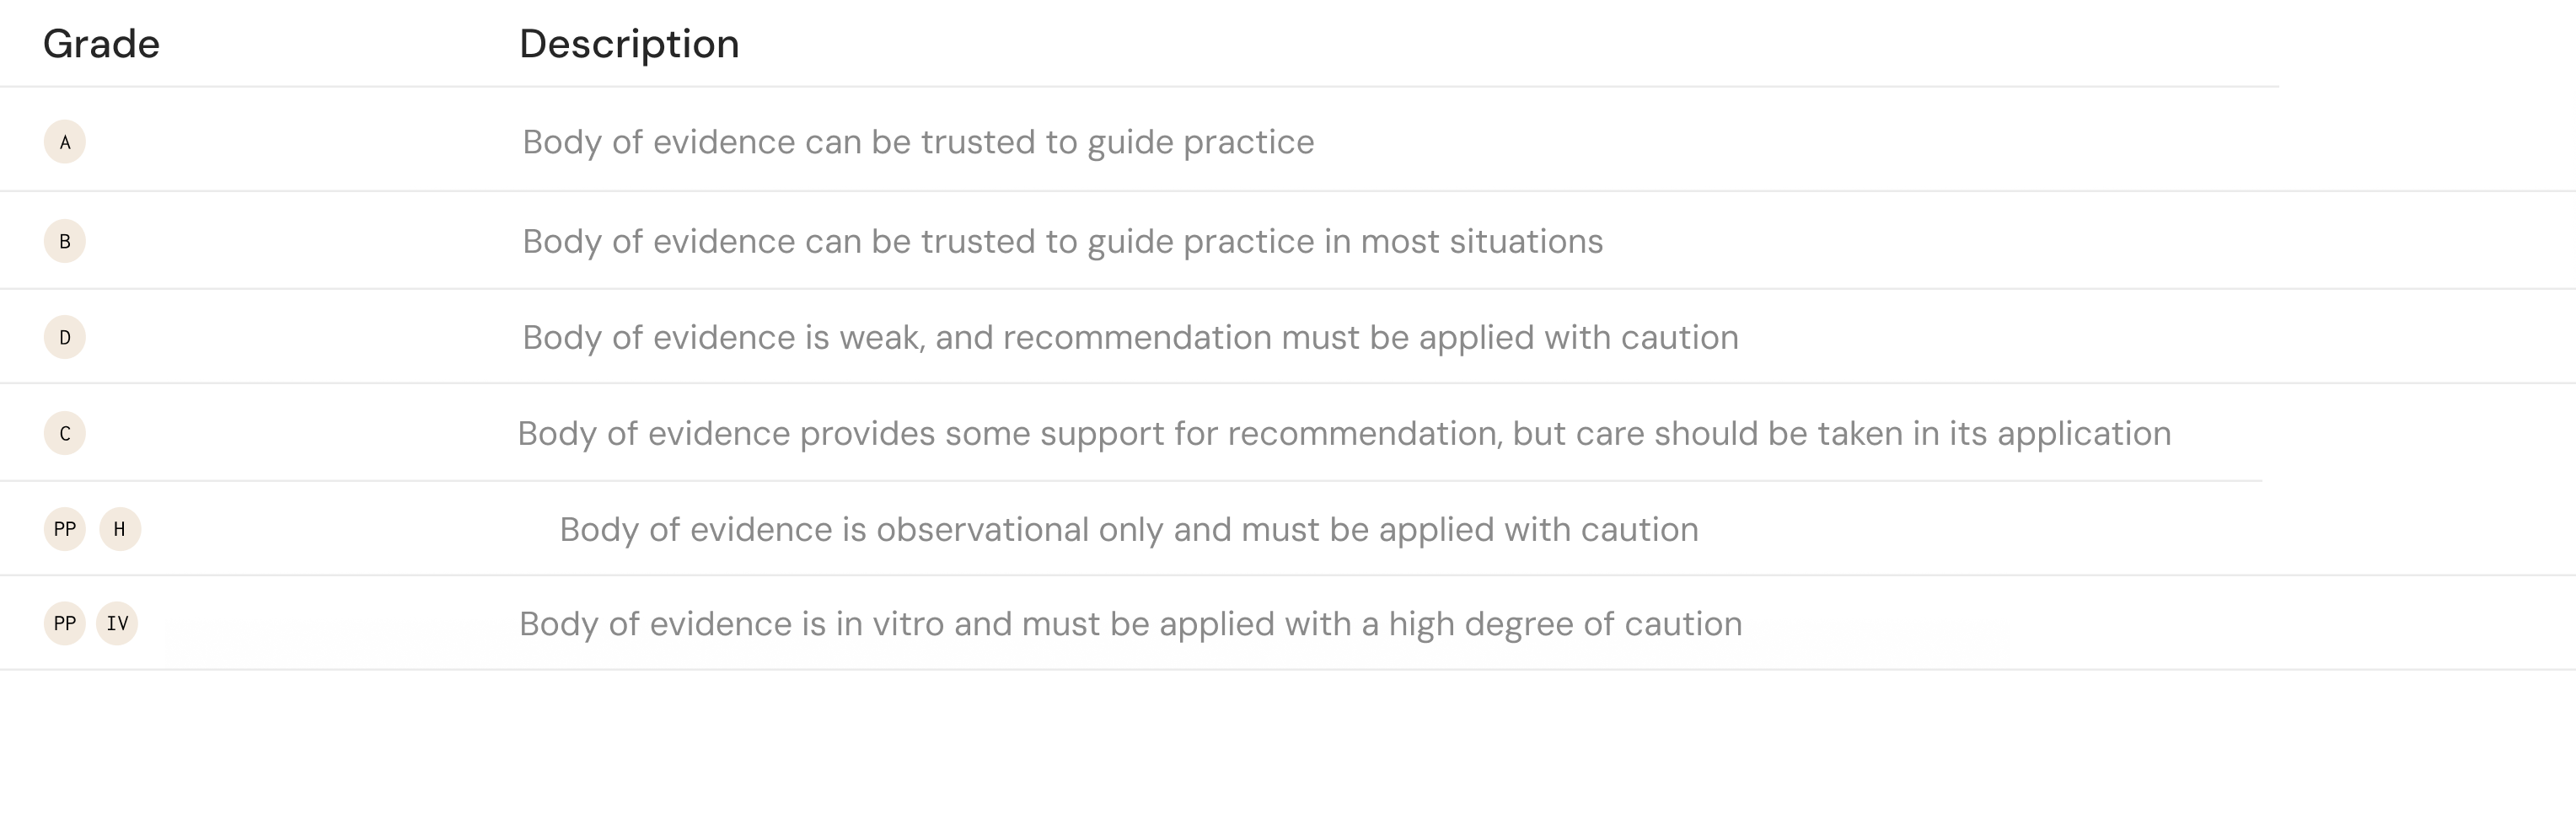
All results are compared to Microba's healthy cohort to determine whether they fall within or outside the expected range.

Tips for patients discussion
Your report shows that the number of different microbial species in your gut is lower than we would ideally see. A more varied microbiome is generally more resilient. A richer microbiome is generally considered more resilient. A key way to support this is through a varied, minimally processed diet with a wide range of plant foods.
How results are calculated
All microbiome marker results are compared against the Microba Healthy Cohort — a purpose-built reference group of more than 450 healthy individuals, collected and analysed using the same workflow as patient samples.
Each marker is scored by comparing the patient's relative abundance against the cohort average. The distance from this average is expressed as standard deviations, and determines whether a result is classified as Low, Borderline, or High.
Source references for all clinical associations, interpretation definitions, and patient management insights on this card.
1. Fassarella, M. et al. Gut microbiome stability and resilience: elucidating the response to perturbations in order to modulate gut health. https://doi.org/10.1136/gutjnl-2020-321747 (2021) doi:10.1136/gutjnl-2020-321747.
2. Lozupone, C. A., Stombaugh, J. I., Gordon, J. I., Jansson, J. K. & Knight, R. Diversity, stability and resilience of the human gut microbiota. Nature 489, 220–230 (2012).
3. Huang, X. et al. Dietary variety relates to gut microbiota diversity and abundance in humans. Eur J Nutr 61, 3915–3928 (2022).
4. Tap, J. et al. Gut microbiota richness promotes its stability upon increased dietary fibre intake in healthy adults. Environ Microbiol 17, 4954–4964 (2015).
5. Claesson, M. J. et al. Gut microbiota composition correlates with diet and health in the elderly. Nature 488, 178–184 (2012).
6. Segev, T. et al. Diet–microbiome associations in 10,068 individuals from the Human Phenotype Project to guide personalized nutrition. Nat Med 1–11 (2026) doi:10.1038/s41591-026-04312-x.